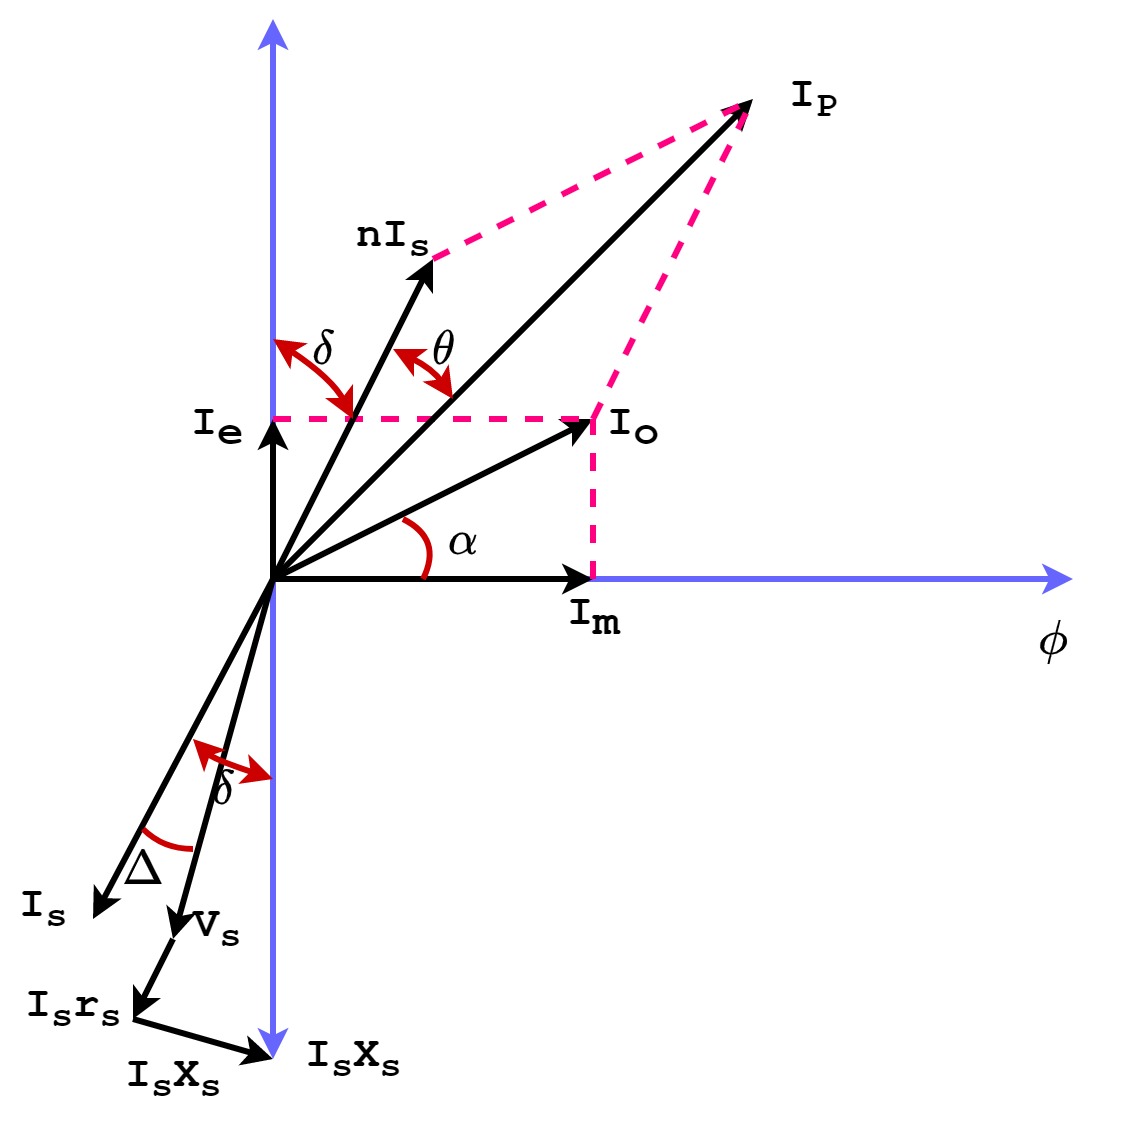
Understanding Potential Transformer Phasor Diagrams
Ever wondered how engineers visualize the complex relationships within electrical transformers? The answer lies in the elegant simplicity of phasor diagrams. Specifically, the potential transformer phasor diagram provides a powerful visual tool for understanding the behavior of these critical power system components. This graphical representation clarifies the phase relationships between voltage and current, offering insights into transformer operation under various conditions.
A potential transformer (PT), also known as a voltage transformer, is used to step down high voltages to safer, measurable levels. These transformers play a crucial role in power system protection and metering. The phasor diagram for a potential transformer is a simplified representation of the voltage and current relationships within the transformer, expressed as rotating vectors, or phasors. These diagrams are essential for analyzing transformer performance and diagnosing potential issues.
Historically, the development of phasor diagrams coincided with the advancement of alternating current (AC) power systems in the late 19th century. Engineers needed a way to visualize the sinusoidal nature of AC voltages and currents and their phase relationships. Phasor diagrams emerged as a powerful tool, simplifying complex calculations and enabling a deeper understanding of AC circuit behavior. This understanding became increasingly important with the growth of large interconnected power grids.
The significance of potential transformer phasor diagrams stems from their ability to simplify complex mathematical analysis. Rather than dealing with intricate trigonometric equations, engineers can visually assess the phase relationships between primary and secondary voltages, the magnetizing current, and the load current. This visualization is crucial for understanding how the transformer responds to different load conditions and for identifying potential problems like phase shifts and voltage imbalances.
A key aspect of understanding these diagrams is grasping the concept of phasors. A phasor represents a sinusoidal quantity (like voltage or current) as a rotating vector. The length of the vector represents the magnitude of the quantity, while the angle represents its phase relative to a reference phasor. In a potential transformer phasor diagram, the primary voltage phasor is typically taken as the reference. The secondary voltage phasor, ideally, is in phase with the primary voltage but scaled down by the turns ratio. The magnetizing current phasor lags the primary voltage by approximately 90 degrees.
Benefits of using potential transformer vector diagrams include simplified analysis of voltage relationships, easier identification of phase shifts, and a better understanding of transformer operation under varying load conditions. For instance, by observing the angle between primary and secondary voltage phasors, we can quickly determine if there is any phase displacement due to transformer imperfections. Similarly, the magnitude of the magnetizing current phasor provides insights into the core's magnetic properties.
One example of a practical application is in fault analysis. During a fault in the power system, the voltage and current relationships in the potential transformer can change significantly. The phasor diagram can help in understanding the nature and location of the fault.
Another example is in transformer testing. By comparing the measured phasor diagram with the ideal diagram, engineers can identify any discrepancies and assess the health of the transformer.
Advantages and Disadvantages of Using Phasor Diagrams
| Advantages | Disadvantages |
|---|---|
| Simplified visualization of complex relationships | Simplified representation may not capture all nuances of real-world scenarios |
| Facilitates easier analysis of phase shifts and voltage magnitudes | Requires understanding of phasor concepts and conventions |
| Aids in troubleshooting and fault analysis | Can be difficult to construct accurately for complex systems |
Frequently Asked Questions:
1. What is a phasor? A phasor is a rotating vector representing a sinusoidal quantity.
2. Why are phasor diagrams used for potential transformers? They simplify analysis of voltage relationships.
3. What does the angle between phasors represent? Phase difference.
4. What is the significance of the magnetizing current phasor? It provides information about the core's magnetic properties.
5. How are phasor diagrams used in fault analysis? They help in understanding the nature and location of the fault.
6. What is the turns ratio in a potential transformer? The ratio of primary to secondary voltage.
7. How do phasor diagrams help in transformer testing? They allow for comparison with ideal diagrams to identify discrepancies.
8. What is the relationship between the primary and secondary voltage phasors in an ideal PT? They are in phase, with the secondary voltage scaled down.
In conclusion, potential transformer phasor diagrams are invaluable tools for anyone working with power systems. They provide a clear, concise, and visual way to understand the complex relationships between voltages and currents within these critical components. By simplifying analysis and aiding in troubleshooting, phasor diagrams contribute significantly to the efficient and reliable operation of power grids. Understanding and utilizing these diagrams is essential for power system engineers and technicians. Explore resources like textbooks on power system analysis and specialized software for creating and analyzing phasor diagrams to deepen your understanding and improve your practical skills.
Effortless motorcycle insurance online
Unlock the bible your free guide to beginner studies
Soaking up the cost a deep dive into tub and surround installation


